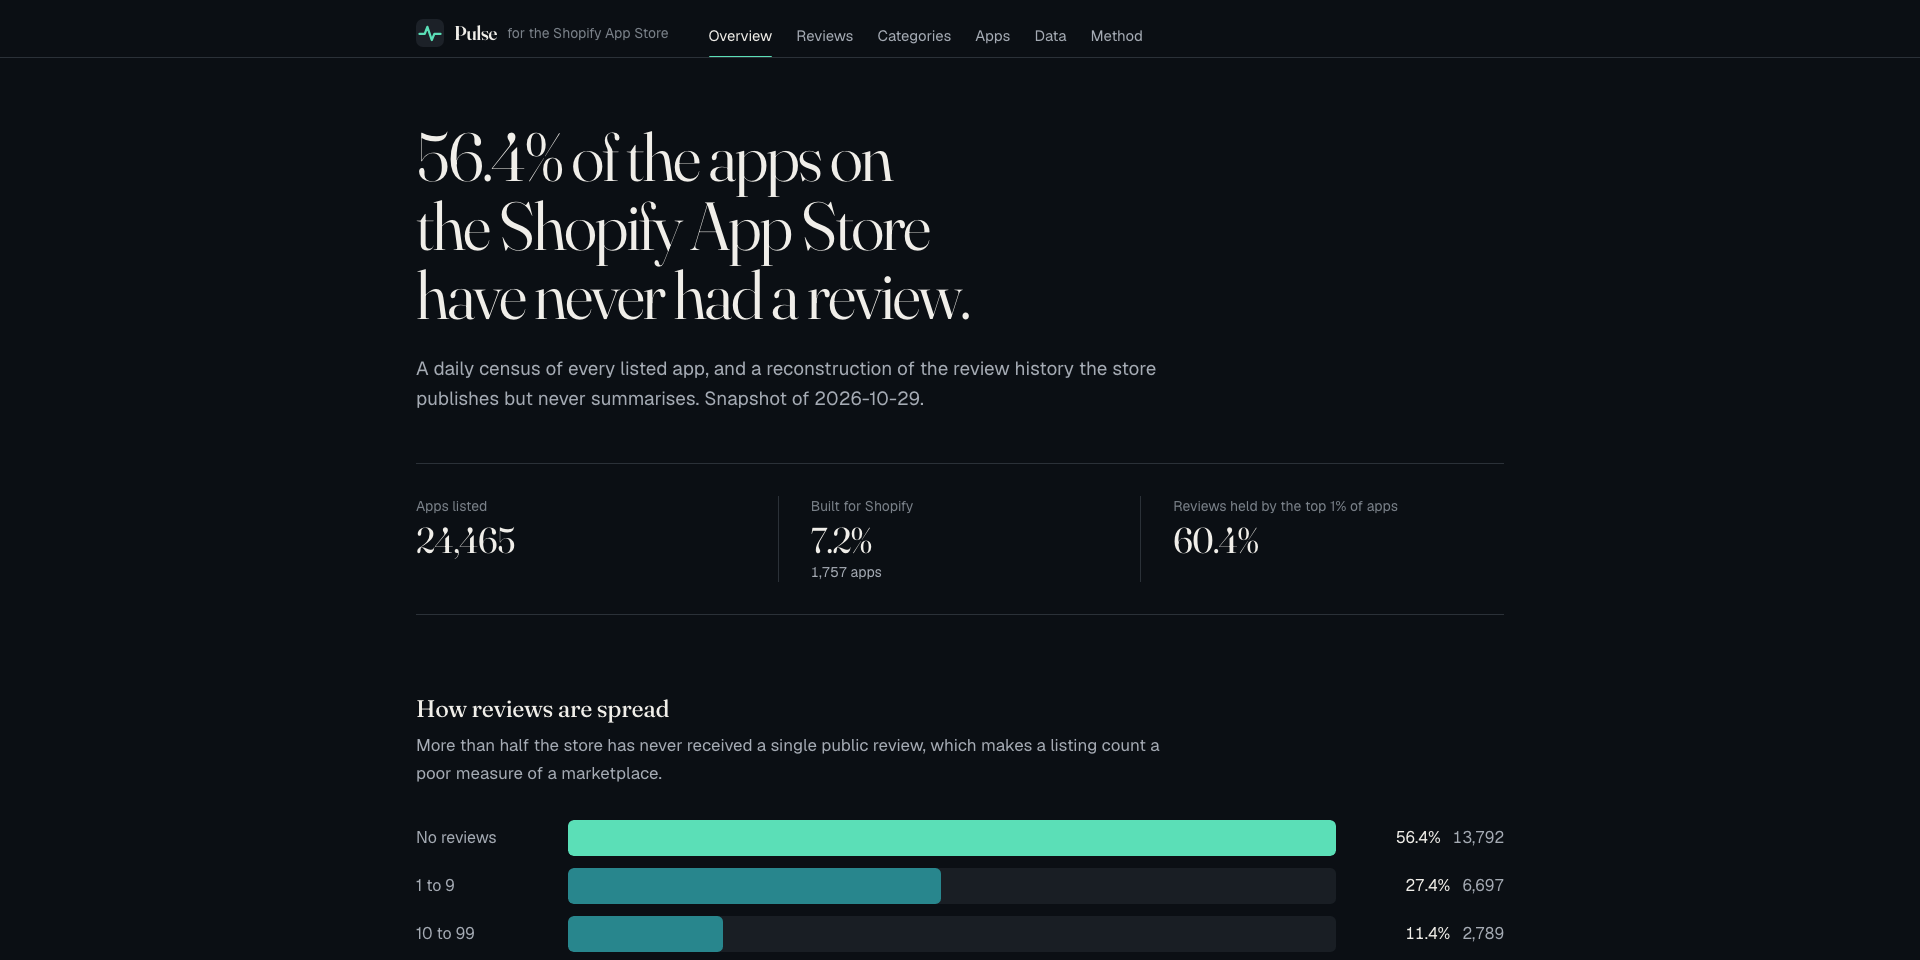
56.4% of the apps on the Shopify App Store have never received a single public review. Of the reviews that do exist, 27.7% were written within the first day of the merchant using the app, and the median review comes 17 days in. Merchants pick apps by star rating, and a large share of what those stars record is how the first few weeks went.
I built Pulse for the Shopify App Store to measure the store from its public pages, out of curiosity about a marketplace that publishes almost nothing about itself. It’s independent and not affiliated with Shopify. The first thing it shows is how lopsided the reviews are.
A Census Without an API
Shopify has no public API for the app store. The category listing pages are server-rendered, though, and each app card carries the handle, name, rating, review count, pricing label and Built for Shopify badge right in the markup.
Walk the category tree down to the leaf categories, each with a paginated view of every app in it. Crawl every leaf, dedupe by handle, and you have the census.
Shopify publishes no history of its own store size either. Pulse crawls daily, so the series for app count, total reviews, new listings and delistings starts the day the crawl started and grows from there.
Reviews Pile Up at the Top
The 2026-10-29 snapshot lists 24,465 apps. Here’s how reviews spread across them:
- 0 reviews: 56.4%
- 1 to 9 reviews: 27.4%
- 10 to 99 reviews: 11.4%
- 100 to 999 reviews: 4.2%
- 1,000 or more: 0.6%, which is 159 apps
The top 1% of apps hold 60.4% of all reviews. WordPress.org has a similar problem with install counts and with search ranking. When someone quotes the size of the store, they’re quoting a number where more than half the entries have no public track record, so a listing count is a poor measure of this marketplace.
Tenure at Review
Reviews come ten per page, newest first, and the pagination runs back to an app’s first review. Each one has a stable id, a date, a star rating, the merchant’s name and country, and how long the merchant had been using the app when they wrote it.
I call that last field tenure at review. It’s the reason the project exists, because it lets you ask when merchants leave their ratings. The store’s ranking surfaces don’t use it, and Shopify doesn’t publish it.
The distribution is heavily front-loaded. 27.7% of reviews arrive within the first day of use and 41.0% within the first week. The median tenure at review is 17 days. A large share of what the stars measure is onboarding.
Ratings Drift Down With Tenure, Mostly Through Composition
Average rating by tenure:
| Tenure at review | Average rating |
|---|---|
| Under a day | 4.85 |
| 1 to 7 days | 4.85 |
| 1 to 4 weeks | 4.82 |
| 1 to 3 months | 4.82 |
| 3 to 6 months | 4.80 |
| 6 to 12 months | 4.78 |
| 1 to 2 years | 4.74 |
| Over 2 years | 4.68 |
Read quickly, that says merchants sour on apps over time. I checked it inside individual apps, comparing first-day reviews against reviews from merchants a year or more in, restricted to apps with enough reviews at both ends. The average gap is 0.043 stars, the median is 0.007, and only 52.8% of those apps rate their first-day reviews above their year-plus ones.
The store-wide slope comes from which apps collect which reviews. Apps that collect reviews at install carry slightly higher ratings than apps whose reviews arrive later, with a correlation of 0.16.
What the Data Can’t Say
Tenure is observed at the review, not at churn, so it sets a minimum for how long the merchant stayed. Reviewers are also a self-selecting minority of merchants. These numbers aren’t a churn rate.
How the Crawler Behaves
The store’s robots file disallows any URL carrying a search query, so Pulse doesn’t track keyword positions. Requests are paced, and the crawler halves its own concurrency whenever the store pushes back.
The Data Is Free
Everything above comes from public pages. The data page offers CSVs of every listed app, the daily store totals, and a 50,000-review sample. Attribution is appreciated but optional.
Related





Leave a Reply